Table of Contents
| 1. Advanced Variables |
| 2. Grass Grows... |
| 3. Giving Birth. |
| 4. Creating a graph. |
In the previous practical session, you created a full (albeit simple) NetLogo model of some sheep eating grass. In this practical, we will improve the realism of the model and add some new functionality:
Before getting started, make a copy of the NetLogo model that you made for practical 2. In this practical we will improve the realism of that simple model, but it is worth copying it in case you want to go back to the original at any time. The easiest way to do this is to simply copy the file using Windows Explorer.
When you have done that, move on to the first part to begin.

Recall from practical 1 that variables can
be used to hold information about different objects in NetLogo. For example, turtles might
have a variable called age that saves the age of each turtle. Similarly,
patches might have a variable called grain that stores (for example) the
amount of grain growing on each patch.
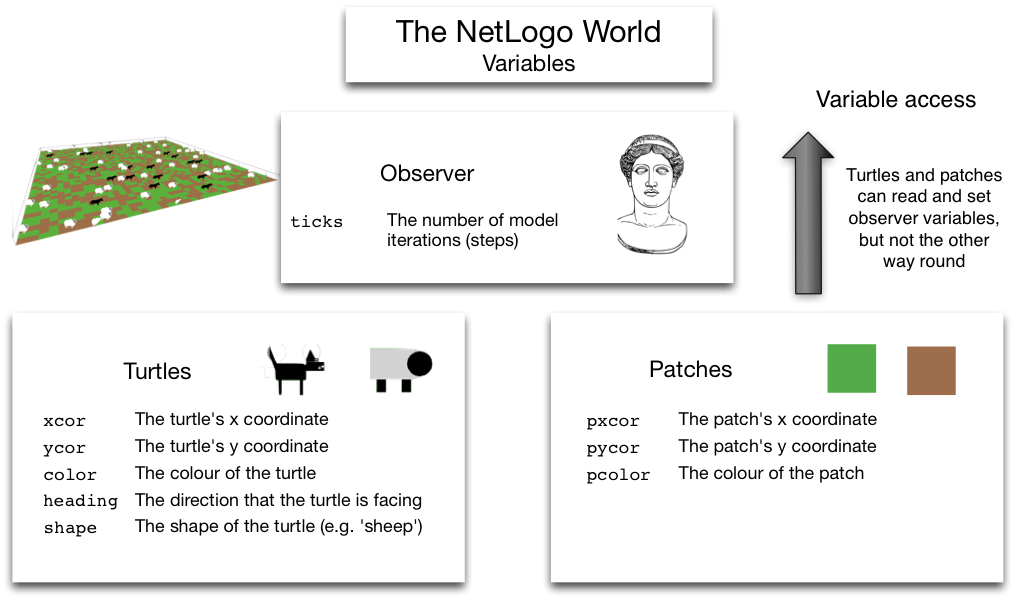
We have already made use of some turtle and patch variables, such as color,
xcor and ycor (for turtles), or pcolor for
patches. These are build in to NetLogo; you can see a full list of built in variables here:
http://ccl.northwestern.edu/netlogo/docs/dictionary.html#builtinvariables
However, to build more interesting models we need to be able to create new variables to store different pieces of information that might be required for the system under investigation. This part of the practical will look at how to do this.
We want to create two new variables. One, called energy, will store the
amount of life energy each turtle has. If this reaches 0 then they die. The second
variable, time-since-eaten, will store the amount of time that has passed
since a patch of grass has been eaten. Grass takes some time to regrow, so this variable
can tell us when a patch has completely regrown.
to setup line).
                    turtles-own [


                     energy


                    ]


                    patches-own [


                     time-since-eaten


                    ]
In the code above, turtles-own tells NetLogo that we are going to
define some new variables that will belong to the turtles. Variables can then be
created in between the square brackets (one per line). We create a single variable
called energy. Similarly, the patches-own code means that
we are about to define variables for the patches.
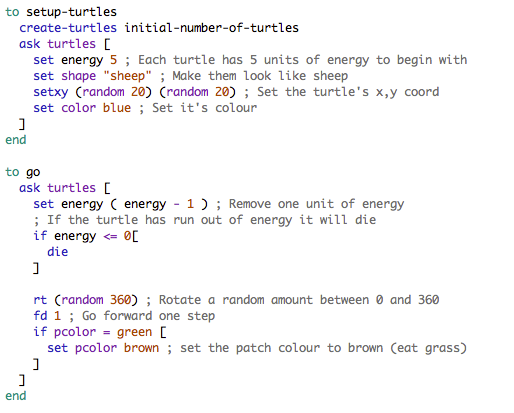
We will make use of the energy variable right away.
setup-turtles procedure, just after the
ask turtles [ line:
set energy 5
This will give each turtle 5 units of energy at
the beginning of the model. (See the right image if you're not sure exactly where the
new code should go).go procedure, just after the
ask turtles [ line:
                set energy ( energy - 1 )


                if energy <= 0[


                   die


                ]
The first line reduces the value of the energy variable by one. So, each
time the model iterates every turtle will lose one unit of energy. The next line
(if energy <= 0[) checks to see if the turtle has lost all its energy. If
it has, then the die command removes the turtle from the model. (If you're
confused about the 'if' statement, refer to
the lecture ).You'll notice that in the image of the code above, some of the text is grey. In
NetLogo, anything that appears after a ';' symbol is called a
comment. These aren't actually read by NetLogo - they can be used by the
developer to explain what it is that their code is doing. Always include
comments in your code! These aren't just so that other people can understand
your code, they are also so that you can remember what your code does in case you
forget.
Anyway, now the turtles have some energy when they are created and each time the model iterates they lose some. To conclude this part of the practical, we will add some code to make the agents eat grass and gain energy.
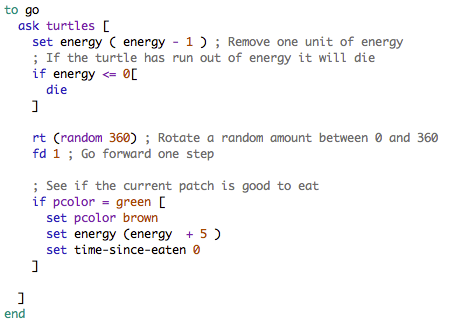
go' procedure, find the code that makes the turtles eat the
grass:
                if pcolor = green [


                 set pcolor brown


                ]
All that code does is change the colour of the patch that the turtle is standing on.
Add two new lines so that the code now reads:
                if pcolor = green [


                     set pcolor brown


                     set energy (energy  + 5 )


                     set time-since-eaten 0


                ]
The new code still changes the colour of the patch from green to brown to indicate that
it has been eaten. But now it also gives the turtle five units of energy and sets
the time-since-eaten variable to 0 to indicate that no time has
elapsed since the patch was eaten. (This will be important later when we want grass
to grow back slowly over time).
Note: the more keen-eyed of you will have noticed that time-since-eaten
is a variable that belongs to the patches, so we shouldn't be able to change it from
within the turtle context (i.e. in an ask turtles [ ... ] block). Remember
we can get around this because NetLogo lets you access patch variables from the turtle
context for the patch that a turtle is currently standing on. This is quite
important; if you're confused either ask a demonstrator or refer back to the
variables diagram
from the lecture.
Have a go at the questions below and make sure you're comfortable with the answers, then move on to part 2.
happiness by ten units.
deprivation is greater or equal to twenty and, if it is greater,
set it to zero:
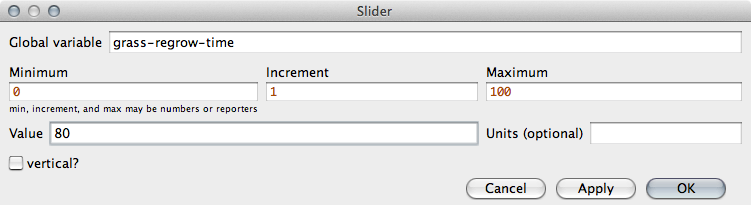
This part is very short - all you need to do is add a few lines so that the grass in the model re-grows after a certain amount of time. Importantly, we are going to create a slider so that the person running the model can experiment with different regrowth times.
grass-regrow-time (if you
can't remember how to create sliders, have a look back at
practical 2). Give the slider a range of
0 to 100 with a default value of your choice (I chose 80).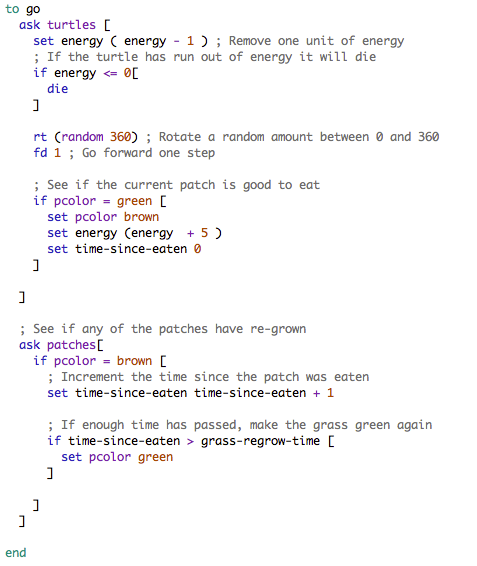
Recall that, in NetLogo, sliders represent variables. So, if you have created
a slider called grass-regrow-time, NetLogo also makes a variable called
grass-regrow-time that you can refer to in your model code. The variable
will be part of the observer context, so all turtles and patches can see what
value it holds. We are going to use this variable to determine how long it takes for
grass to regrow once it has been eaten.
go procedure, once the
ask turtles block has finished (after the closing ']'):
                ask patches[


                 if pcolor = brown [


                  set time-since-eaten time-since-eaten + 1


                  if time-since-eaten > grass-regrow-time [


                   set pcolor green


                  ]


                 ]


                ]
(see the right image if you're not sure where the code should go).It might look complicated at first, but the code above doesn't do anything that you haven't seen before. Its overall job is to see if enough time has passed for brown patches to become green again. The following table explains what each line does:
| Code | Explanation |
|---|---|
ask patches [ |
This tells NetLogo to run through the patches, one by one, so we can see if they are ready to re-grow. |
if pcolor = brown [ |
This checks the colour of an individual patch. If the patch is brown then it might be time to regrow. If it is green, then we just ignore it. |
set time-since-eaten time-since-eaten + 1 |
This increases the value of the time-since-eaten variable by
one unit. This is how we keep track of the amount of time that has passed since
the patch became brown (i.e. the grass was eaten). |
if time-since-eaten > grass-regrow-time [ |
Here, we make use of the grass-regrow-time slider. If enough
time has passed since the patch become brown, the we can do something to it. |
set pcolor green |
This simply changes the colour of the patch from brown to green. Importantly, the line above makes sure that this will only happen if enough time has passed. If enough time hasn't passed, then the patch will stay brown (for now). |
] |
This finishes the if time-since-eaten > grass-regrow-time [
block. |
] |
This finishes the if pcolor = brown [ block. |
] |
This finishes the ask patches [ block. |
Understanding the logical flow of the program as it compares variables and decides
what to do is a common task in computer programming and a very useful skill in general.
If you're not sure about how the if commands work, have a look back at
the lecture .
Now you can move on to the next part where we will allow the turtles to give birth.
Like the last section, this part is quite short. All that you need to do is add a few lines so that if the turtles have enough energy then they can give birth.
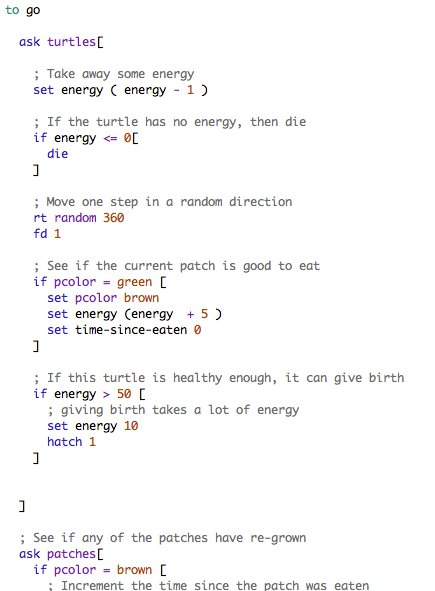
go procedure, after the turtle
has decided whether or not a patch of grass is good to eat:
                if energy > 50 [


                 set energy 10


                 hatch 1


                ]
That's it! The code above checks to see if the turtle has more than 50 units of
energy stored up. If it does, then we reduce the amount of energy to 10 (to simulate
the stress of giving birth) and then use the hatch command to create
a copy of the turtle.
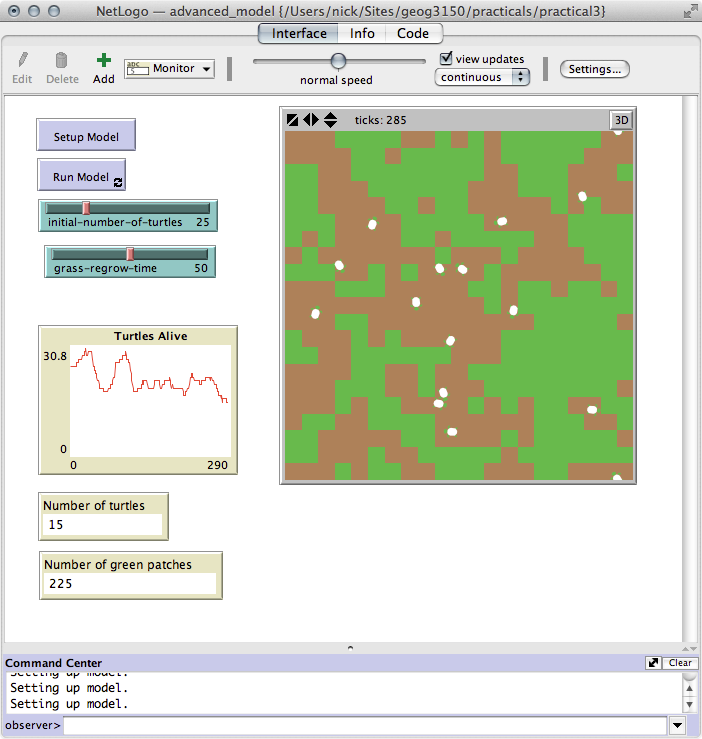
grass-regrow-time slider. If you change the amount of time it takes for
grass to re-grow, does this have an impact on the number of turtles in the model?
You'll probably notice that it is quite hard to work out how many turtles are actually in the model at any given time. It would be better if there was a way to see exactly how many turtles are alive at any given time. This is something that will be addressed next.
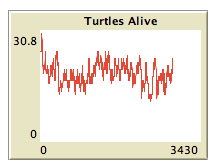
In the very last part of this practical, you will create a graph that shows the number of turtles alive on the y axis and the number of model iterations on the x axis. This is explained in detail in the NetLogo tutorial (see the Plotting section). Most of the material here has come from that tutorial.
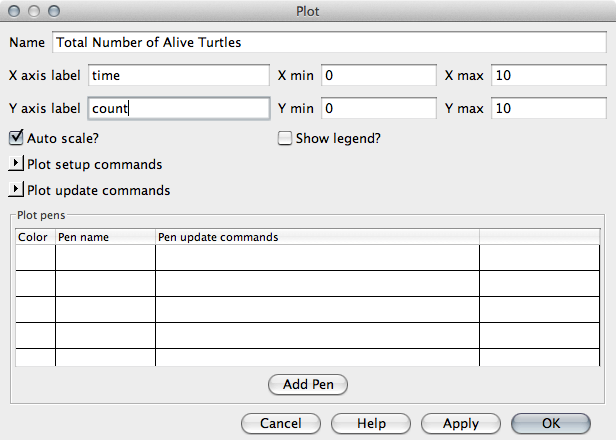
| Name: | Total Number of Alive Turtles |
| X axis label | time |
| Y axis label | count |
| Auto scale: | ✓ (This makes the axes grow over time) |
|
Next, we need to tell NetLogo how to draw the graph. To do this, it uses something called 'Plot Pens'. It is possible to have multiple pens per graph to draw a number of different things simultaneously. For this practical, we will create a single 'pen' that draws the number of turtles who are alive at a given time.
turtles-alive and choose a colour for the pen
(this will determine the colour of the line on the chart). In the right figure I chose
orange, but the colour doesn't matter.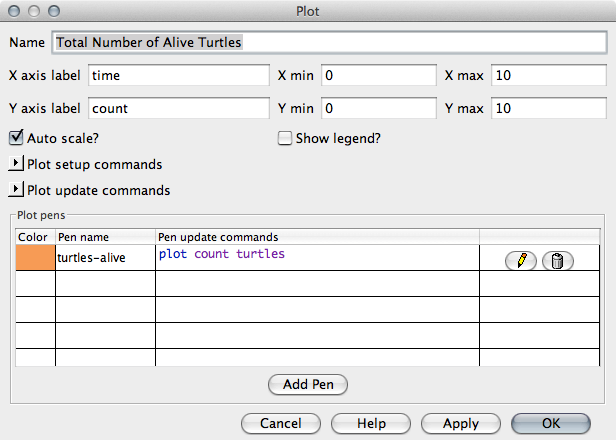
plot count turtles
This will plot the number of turtles currently in the model.Try running the model, sadly nothing will be drawn on the graph. To make the graph work there are two very small changes that we need to make to the model.
setup procedure, add the following code just before creating
the patches and the turtles:
__clear-all-and-reset-ticks
What this strange command does is remove everything from the model and reset the 'tick
counter' to zero. This will be run each time you click on the 'setup' button. If we
don't do this, then the graph never goes back to zero, even after the model has been
reset. setup procedure should now look something like this:
                to setup


                 print "Setting up model."


                 __clear-all-and-reset-ticks


                 setup-patches


                 setup-turtles


                end
go procedure. At the very end, just before the
end command (that tells NetLogo we have finished with the go
procedure add the single command:
tick
This makes NetLogo increment it's internal clock so we know how many iterations have
passed since the model began running. The plot needs to know this.That's it! Now go back to the Interface tab and try to run the model. Does the graph
work? Experiment with the grass-regrow-time slider again. Does the graph make
it easier to see what affect the slider has on the size of the turtle population?
That's everything for Practical 3. You now have a reasonably advanced model with animals that eat grass, give birth, and die. To finish off, have a go at the activities below.
NetLogo has lots of different items that can provide information about a model. We have seen how graphs work; other items include monitors to display numbers (e.g. counts of things) and labels to show information about individual turtles or patches. The NetLogo tutorial has details about how to create these elements.